Table of Contents
For generations, blue- and gray-lined grid paper has been an essential staple of mathematics classrooms, science laboratories, and study desks. Long before students encounter algebraic proofs or multivariable calculus, the simple square grid provides an intuitive visual anchor for abstract numbers.
When learners put pencil to graph paper, numbers cease to be arbitrary symbols on a blackboard; they take on physical presence, spatial orientation, and quantifiable magnitude.
Yet while physical paper pads have served education faithfully for centuries, modern teaching environments increasingly demand flexibility, visual iteration, and interactive collaboration that static paper cannot support alone. Digital graph paper has emerged not merely as a substitute for stationery, but as an interactive visual environment that transforms how students conceptualize spatial math, coordinate systems, and geometric proofs.
Why Visual Grids Are Fundamental to Mathematical Comprehension
Human cognition relies heavily on spatial reasoning to process mathematical concepts. Without a consistent spatial reference, relationships between numbers can feel disconnected from physical reality.
1. Spatial Structure and Magnitude
When young learners first explore multiplication or division, grids provide an intuitive array model. A 4-by-6 rectangle drawn on a grid visually demonstrates that multiplication represents repeated addition and uniform area. The individual cells turn an abstract formula into an easily countable, verifiable set of units.
2. Proportional Reasoning and Scale
Understanding fractions, ratios, and percentages requires recognizing how parts relate to a whole. A uniform grid supplies an objective scale. Students can shade sections, partition regions, and observe visually whether two quantities are proportional, helping bridge the gap between rote memorization and conceptual understanding.
3. Error Reduction in Work Organization
A persistent obstacle in math education is simple mechanical disorganization: misaligned decimal points, crooked columns of numbers, and distorted shapes. Graph paper acts as an automatic organizational guide, allowing learners to focus cognitive effort on analytical problem-solving rather than struggling to keep their arithmetic tidy.
Coordinate Geometry: Moving Beyond Static Hand Plots
Coordinate geometry is where many students first encounter serious friction with traditional paper. Plotting points on a Cartesian plane sounds straightforward in theory, but execution on paper brings distinct practical challenges.
          y-axis
            ^
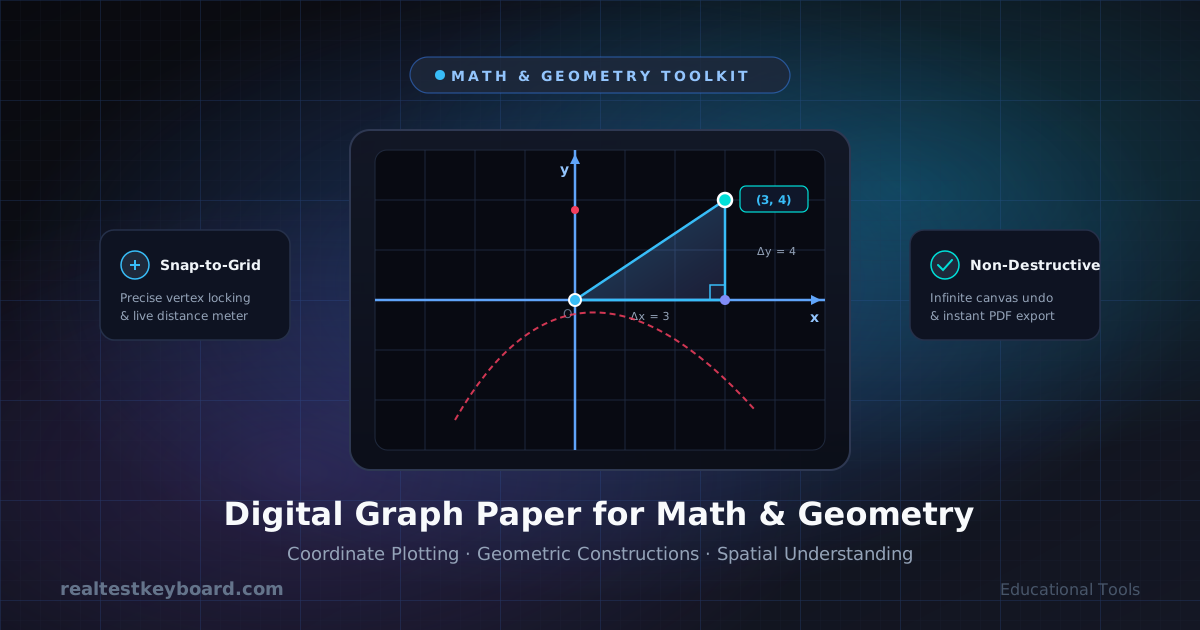
            |       *(3, 4)
            |
            |
  ----------+----------> x-axis
            | (0,0)
            |
Visualizing Point Coordinates and Quadrants
Locating an ordered pair like (4, -3) requires tracking two independent directional movements along perpendicular axes. On paper, students frequently miscount grid lines, draw unevenly spaced tick marks, or confuse positive and negative trajectories.
Digital coordinate grids eliminate manual measuring friction by providing clear, labeled axes with consistent scaling across all four quadrants. This clarity helps students build confidence with fundamental concepts:
- Identifying quadrant locations instantly based on sign conventions: (+, +), (-, +), (-, -), and (+, -).
- Recognizing relationships between coordinates, such as reflections across the x-axis or y-axis.
- Understanding origin-relative displacements without getting lost in hand-drawn axis inaccuracies.
Visualizing Slope and Linear Relationships
The algebraic definition of slope—often taught as “rise over run” or Δy / Δx—can feel unintuitive when treated as a formula in isolation.
On a grid, slope becomes an observable physical incline. By drawing a line across coordinates and counting the vertical change against the horizontal run, learners observe directly how a steep incline produces a large slope, a gentle grade yields a fraction, and a downward trend produces a negative value.
Geometric Constructions: Accuracy Without Broken Compass Leads
Geometric construction has historically relied on physical instruments: straightedges, protractors, and mechanical compasses. While handling these tools teaches tactile motor control, instrument slips frequently introduce errors that obscure the underlying geometric theorems.
Accurate Angles and Polygons
When students construct triangles, quadrilaterals, or regular polygons on static paper, a two-millimeter error with a pencil can ruin an entire proof. If an angle intended to measure 90° ends up at 87°, subsequent perpendicular relationships, hypotenuse calculations, and trigonometric proofs break down.
Digital grid interfaces solve this by incorporating snap-to-grid capabilities. Lines snap cleanly to exact vertices, angles lock to specified increments, and parallel segments remain true.
Geometric Transformations in Real Time
Understanding symmetry, translations, rotations, and dilations requires visualizing movement. On physical paper, demonstrating a 90° rotation around a center point requires tracing paper, eraser marks, or redrawing the figure from scratch.
Digital workspaces allow students to define a shape, apply a transformation, and immediately inspect how vertex coordinates adjust. This feedback loop makes spatial transformations tangible and repeatable.
Bridging the Gap: Physical Paper vs. Digital Graph Paper
While physical notebooks will always have a place in education, their structural limitations become apparent during complex assignments.
| Feature | Traditional Physical Graph Paper | Digital Graph Paper |
|---|---|---|
| Workspace Boundaries | Confined to fixed page dimensions (e.g., Letter/A4) | Virtually infinite panning and zooming |
| Correction & Editing | Eraser smudges, paper tears, messy white-out | Non-destructive undo/redo history |
| Axis Customization | Must be hand-drawn and manually labeled | Instant toggling of scales, origins, and intervals |
| Measurement Feedback | Manual measurement with external ruler/protractor | Real-time coordinate readouts and segment lengths |
| Distribution & Sharing | Physical hand-in or awkward phone snapshots | Direct vector, image, or PDF exports |
The Problem with Fixed Boundaries
Every math student has experienced the frustration of calculating a function, beginning a graph at the bottom-left of a page, and discovering five minutes later that the critical intercept lies three inches off the paper edge.
With paper, the only options are to squeeze the points unnaturally or scrap the sheet entirely. Digital grids permit fluid panning and zooming, letting students reposition their coordinate plane effortlessly without losing earlier work.
The Power of Non-Destructive Experimentation
Fear of making mistakes frequently inhibits math students. When an incorrect construction means tedious erasing and paper damage, learners become hesitant to explore tentative hypotheses.
A digital interface offers a low-stakes environment: an erroneous point or mismatched line segment can be dismissed with a quick undo command, encouraging exploration, self-correction, and deeper curiosity.
Practical Classroom Applications for Students and Educators
Modern educational environments—encompassing in-person classrooms, remote lectures, and flipped classrooms—benefit substantially when interactive grid workspaces are incorporated into daily lessons.
Teacher Screen (Interactive Board)
       │
       ▼
   [Live Grid Session: y = 2x + 1]
       │
       ├─► Student 1 (Observes Slope Triangle)
       ├─► Student 2 (Plots Intercept Directly)
       └─► Homework PDF Export (Archived for Study)
Dynamic Teacher Demonstrations
Rather than turning their backs to a class to rule chalkboard lines, teachers can project an interactive grid directly onto a digital whiteboard.
When introducing parabolas, circle formulas, or systems of linear equations, educators can plot values on the fly, adjust parameters, and show students how curves shift in response to coefficient changes.
Efficient Remote Tutoring and Collaborative Review
For online tutors and remote study sessions, static webcam shots of paper notebooks are notoriously blurry and difficult to read.
Utilizing free online graph paper enables instructors and students to work together within a clear, browser-accessible canvas. Both parties can inspect identical coordinate markers, verify vector directions, and critique homework problems without needing proprietary software or complex account registrations.
Step-by-Step Homework Solutions
When preparing math homework assignments or lab reports, students often need clean, professional diagrams.
Instead of taping rough paper sketches into typed documents, learners can construct clear geometric proofs online and export vector images or PDFs directly into their reports, reinforcing organized academic habits.
When Printable Graph Paper Remains Indispensable
Despite the distinct advantages of digital tools, physical graph paper remains a vital component of a comprehensive learning journey.
Early Fine Motor Skill Development
Younger children in early elementary grades require tactile physical feedback to build fine motor precision. Gripping a pencil, feeling paper texture, and learning to guide a straightedge develop fundamental dexterity that touchscreen tapping cannot entirely replace.
Standardized Examination Environments
Most state, national, and university entrance exams (such as the SAT, ACT, AP exams, or GCSEs) still require students to calculate, sketch, and interpret charts under strict analog conditions.
Regular practice with physical sheets ensures students remain comfortable with manual plotting speeds, mechanical compasses, and hand-ruled axes when digital devices are prohibited.
The Ideal Balance: A Hybrid Learning Strategy
The most effective mathematics education does not pit digital tools against traditional notebooks; it combines their respective strengths thoughtfully:
- Initial Concept Exploration: Use digital graph paper to experiment with formulas, test shapes, and explore transformations without fear of errors.
- Classroom Presentations & Discussions: Leverage browser-based grids on interactive displays to share visual proofs and work through multi-step problems collaboratively.
- Formal Pen-and-Paper Practice: Solidify tactile calculation speed on printed grid sheets to prepare for timed testing conditions.
- Final Portfolio & Report Preparation: Return to digital drafting when producing polished, clear figures for science projects, math papers, and lab write-ups.
By understanding the visual and organizational benefits of the humble grid—and embracing modern digital environments that expand its possibilities—students and teachers can turn math from an intimidating exercise in abstract rules into an intuitive, visually rewarding discipline.
Test every key directly in your browser
Detect stuck keys, key chatter, input latency, and full rollover with our instant, zero-download diagnostic tool.
Start Keyboard Test →