Table of Contents
If your GPU handles a plain 3D scene fine but chokes the moment reflections, bloom, or heavy post-processing switch on, the bottleneck is almost always off-screen rendering — the technique of drawing into a texture and reading it back. A rendering to texture test isolates exactly that workload, so you can measure how well your hardware moves pixels through framebuffers rather than how fast it draws one simple scene. This guide covers what the test measures, how to run it cleanly, and how to make sense of the numbers, including the factors that push them up or down.
What this test is really measuring
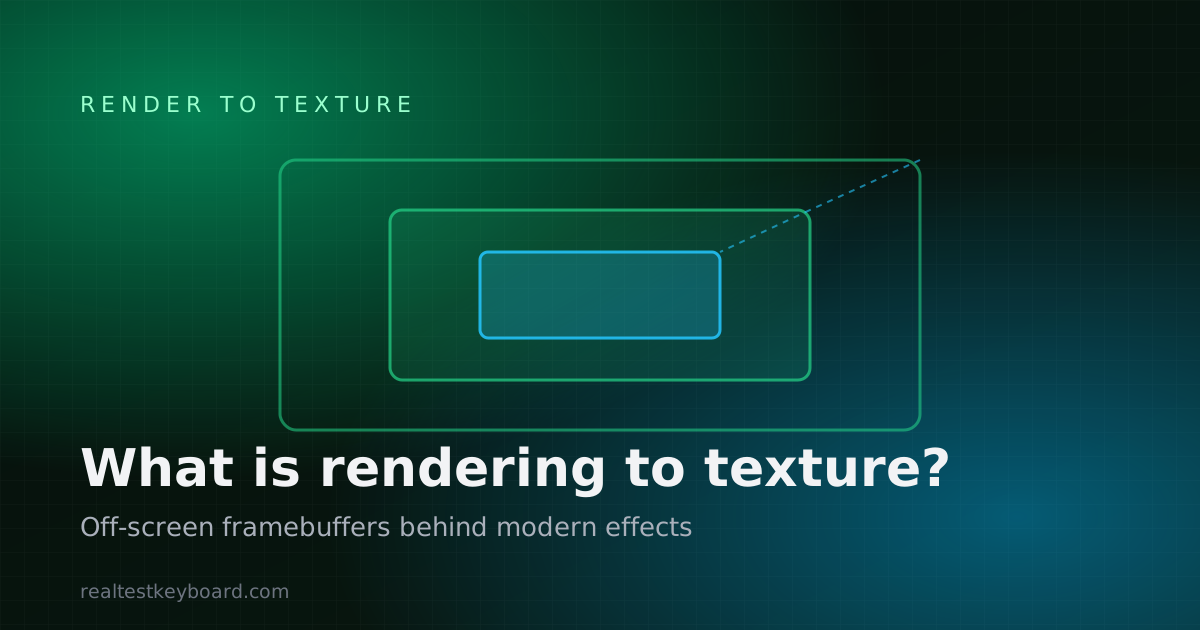
A render-to-texture workload is different from a typical rendering test in one important way: it spends most of its time drawing full-screen images into off-screen targets and then sampling them back. Each pass shades a screen’s worth of pixels and reads from or writes to a texture in GPU memory. Chain several passes together — the way real post-processing does — and a single displayed frame involves the GPU rendering the equivalent of several full screens.
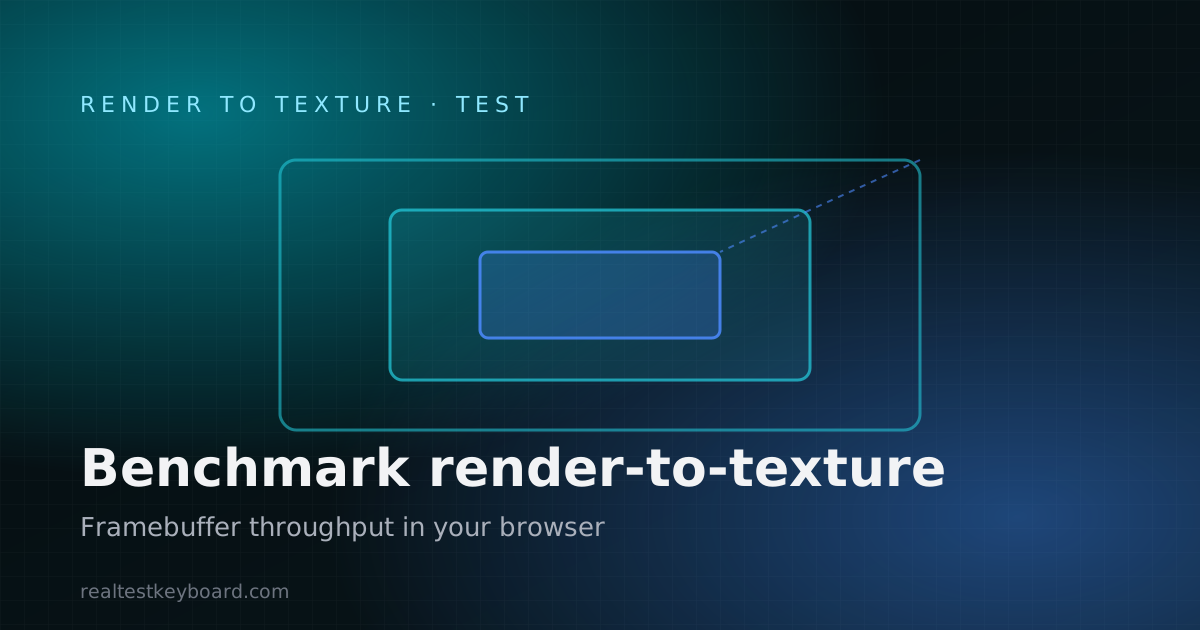
So a rendering to texture test is essentially measuring framebuffer throughput: how quickly your GPU can render into off-screen targets, sample them, and combine them, all bounded by fill rate and memory bandwidth. That makes it a good proxy for how your device will handle post-processing-heavy content, which is exactly where many GPUs show their limits.
It’s worth being clear about what the browser is measuring and what it isn’t. It measures timing with real precision — frames per second, milliseconds per frame, and how consistent those frames are. It does not read GPU temperature, utilisation percentage, VRAM usage, or power draw, because browsers have no API for hardware sensors. When the tool shows a “workload” or “intensity” level, that’s the configured complexity of the pass chain it’s asking the GPU to render — not a measured percentage of how hard the chip is working. The concept side of this — what these passes are and why they exist — is covered in the companion piece on what rendering to texture is if you want the background first.
Running the test the right way
The steps are simple; the discipline is in doing them consistently.
- Open the tool and let it warm up. Launch the rendering to texture test. The first frames after it starts — or after any setting change — are always slower while WebGL compiles shaders and allocates the framebuffers. Let it run a few seconds and ignore that initial spike; it doesn’t represent steady-state performance.
- Establish a baseline. Start at a light setting where the frame rate is clearly smooth. This tells you what “unbottlenecked” looks like on your device.
- Increase the load in steps. Raise the intensity — more passes, higher resolution, whatever the tool exposes — one step at a time, and let each level settle before you read it. You’re mapping how throughput responds as the off-screen work grows.
- Watch for the turning point. Note the setting at which frame time starts climbing and the animation stops feeling smooth. That’s your practical ceiling for framebuffer-heavy work on this hardware and browser.
- Keep conditions identical for comparisons. If you want to compare before and after a driver update, or against another machine, use the same browser, the same window size, and the same settings. A comparison only means something when the conditions match.
Reading FPS and frame time
The numbers to watch are the same trio that matter across all these tools, and they’re more useful read together than apart.
FPS is the quick headline — frames completed per second — but it’s an average, and averages hide unevenness.
Frame time (milliseconds per frame) is the better lens for a render-to-texture test, because this workload is prone to uneven spikes. If frame time climbs steadily as you add passes, you’re watching fill rate and bandwidth fill up in an orderly way. If it jumps around at a given setting, something is causing intermittent stalls — often render-target switching or memory pressure.
1% lows — the slowest ~1% of frames — matter here because post-processing pipelines can hitch when the GPU juggles multiple targets. A high average FPS with weak 1% lows will still feel stuttery, because those worst frames are exactly what your eye catches. A genuinely strong result keeps frame time flat and 1% lows close to the average as you scale the load.
The factors that move your result
Render-to-texture performance is unusually sensitive to a few specific things, and knowing them explains almost every result you’ll see.
- Resolution. This is the dominant factor. Because the passes are full-screen, the pixels each pass must shade scale with resolution — roughly quadrupling from 1080p to 4K. On a high-DPI laptop or phone rendering at native scale, the same test is doing far more work than the screen’s physical size suggests, which is why full-screen results are so much heavier than windowed ones.
- Number of passes. Each additional off-screen pass adds another full-screen render and another texture read. A multi-stage effect like bloom (extract bright areas, blur repeatedly, recombine) stacks several passes, so adding passes raises cost roughly in proportion to how many full screens’ worth of pixels the GPU ends up shading.
- Texture format and precision. Higher-precision render targets (for example, floating-point formats used for HDR) carry more bytes per pixel than standard 8-bit targets, so they cost more memory bandwidth to write and read. A test using higher-precision targets will generally run heavier than one using basic formats.
- Memory bandwidth. Moving image data to and from render targets consumes bandwidth, and a device with limited memory bandwidth will feel render-to-texture load sooner than a raw-shading test would suggest. The browser can’t show you bandwidth directly, but its effect appears as frame times that rise faster than the pass count alone would predict.
- Thermal throttling. A result that starts strong and slowly sags under sustained load is the signature of throttling — the GPU heating up and lowering its clocks to stay safe. You can’t see the temperature in the browser, only its effect on the frame rate.
Testing sustained load responsibly
A render-to-texture test applies genuine, sustained load to your GPU — that’s how it measures throughput. Keep half an eye on the device while it runs. Laptops will warm up, so run on AC power and place the machine on a hard, flat surface so the fans can actually move air; soft surfaces block the vents and force early throttling. Phones and tablets have no fans and will throttle quickly, so read their results as “how this device behaves once it’s hot” rather than a peak figure. There’s nothing risky about a normal test, but if the device gets uncomfortably hot, the fans run flat out without settling, or the display starts glitching, just stop the test and let it cool. None of this involves opening hardware or changing any physical settings.
Putting the result in context
A render-to-texture test is best at revealing fill-rate and bandwidth limits under multi-pass, full-screen work — the profile of post-processing-heavy content. It’s one instrument, not the whole toolbox. Pair it with the broader walkthrough on how to test GPU performance to see where it fits among stress, shader, and particle tests. And since every one of these tools runs on the same graphics API, the guide to the WebGL performance test explains the layer that actually drives your GPU and why WebGL2’s framebuffer features make tests like this one possible.
Frequently asked questions
What does a rendering to texture test actually measure?
It measures framebuffer throughput — how quickly your GPU can render into off-screen textures, sample them, and combine them across passes. In practice it reports timing metrics (FPS, frame time, consistency) as you scale the off-screen workload, which reflects how your device will handle post-processing-heavy content like bloom, reflections, and depth of field.
Why does the test get so much heavier at higher resolution?
Because the passes are full-screen. The number of pixels each pass shades scales with resolution, so going from 1080p to 4K roughly quadruples the per-pass work. With several passes chained together, that multiplier applies to each one, which is why render-to-texture load rises so sharply with resolution and on high-DPI displays.
Can this test tell me my GPU’s VRAM usage or temperature?
No. Browsers can’t read VRAM usage, capacity, temperature, utilisation, or power draw — there’s no web API for those sensors. The test measures timing accurately, so heavy render-to-texture work shows up as rising frame times and falling FPS rather than as a memory or temperature figure. For hardware telemetry you’d need a native tool.
Why do my frame times spike instead of rising smoothly?
Steady frame times that climb as you add passes indicate an orderly fill-rate or bandwidth limit. Spiky frame times at a fixed setting usually point to intermittent stalls — often from switching between render targets or from memory pressure. Watch the 1% lows: if they sit far below the average, those spikes are what will make the result feel stuttery.
How is this different from a regular GPU stress or shader test?
A shader test hammers per-pixel math in a single pass; a general stress test applies broad sustained load. A render-to-texture test specifically exercises the off-screen pipeline — drawing into textures and reading them back across multiple passes — so it stresses fill rate and memory bandwidth together. It’s the closest proxy for how your device handles real post-processing pipelines.
Run a few passes, scale the resolution, and watch where frame time starts to climb — that’s your device telling you how much post-processing headroom it really has. When you’re ready to measure it, open the rendering to texture test and read the frame time and 1% lows rather than the headline FPS.
Test every key directly in your browser
Detect stuck keys, key chatter, input latency, and full rollover with our instant, zero-download diagnostic tool.
Start Keyboard Test →