Table of Contents
Frames per second is the single number people reach for when they want to know if motion looks smooth, but “FPS” on its own hides more than it reveals. A steady 60 and a jittery 60 feel completely different, and only one of them is actually pleasant to watch. A display FPS test in your browser measures how fast your screen is updating right now and — just as importantly — how consistent those updates are, using timing that browsers expose to any web page. This guide explains how that measurement works, what frame time and 1% lows add on top of the headline FPS, how to run the test, and why the number you get is capped by your display’s refresh rate no matter how fast your hardware is.
What FPS means for a display
FPS counts how many distinct frames are drawn to the screen each second. Higher generally means smoother motion, because the picture is updated more often and moving objects step forward in smaller increments. But a display can only show a new image when it refreshes, and it refreshes at a fixed rate — so FPS in a browser is really a measure of how many of the display’s refresh opportunities were filled with a fresh frame, delivered on time.
That framing matters because it sets a hard ceiling. If your panel refreshes 60 times a second, a browser animation cannot show you more than 60 frames per second, because there is no moment in between refreshes to show anything. The relationship between the two numbers is worth understanding on its own; the guide on FPS vs refresh rate covers why they’re distinct and how they interact.
How a browser actually measures frames
There’s no special hardware access involved. Browsers provide a function called requestAnimationFrame, which asks to run a small piece of code once, right before the next screen repaint. A test schedules that callback, and the browser hands it a high-resolution timestamp each time the screen is about to update.
By recording the timestamp on every repaint, the test knows the exact interval between one frame and the next. From those intervals it derives everything else:
- The frame rate (FPS) is simply how many of those intervals fit into a second.
- The frame time is the length of each interval, in milliseconds — the more revealing figure, because it’s what you’re actually measuring before converting to FPS.
Because requestAnimationFrame is synchronised to the display’s refresh, this method measures the real cadence of frames reaching your screen, vsync included, rather than an idealised number. It’s an honest measurement of what you’re seeing.
Why frame time tells you more than FPS
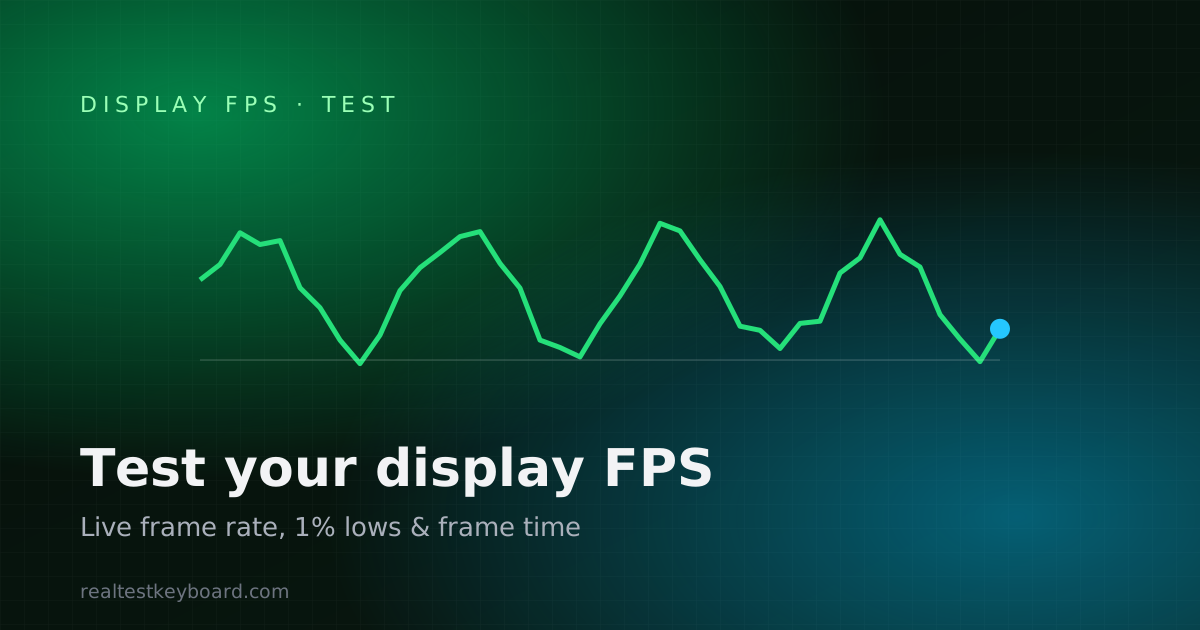
FPS is an average over a second, and averages smooth over exactly the problems you care about. Frame time doesn’t. At a smooth 60 FPS every frame arrives about 16.7 ms apart; if one frame suddenly takes much longer, that single long interval is a visible hitch even though the per-second average barely moves. Watching frame time — or a graph of it — surfaces stutters that a headline FPS number quietly averages away.
What 1% lows are for
The 1% low is a way of describing the worst frames without being thrown off by a single outlier. Sort every frame from fastest to slowest and look at the slowest one percent: that value tells you how bad the rough moments get. A display test that reports both an average FPS and a 1% low is showing you two things — how fast it runs typically and how fast it runs at its worst. When the two are close, motion is consistent; when the 1% low is far below the average, you’re getting occasional hitches even if the average looks great.
Running a display FPS test
The measurement takes seconds. Open the display FPS test and:
- Let it run for a few seconds. The tool animates something and samples frame intervals continuously. Give it time to settle past the first frames, which are often uneven as things warm up.
- Read the average FPS. On an idle, healthy system this should sit close to your display’s refresh rate. Sitting well below it means frames are being missed.
- Watch the frame-time graph. A flat line is what you want. Spikes are stutters — individual frames that took too long.
- Note the 1% low. Compare it to the average. A large gap means inconsistent delivery even if the average is high.
- Try it in fullscreen and with other tabs closed. Background work competes for the same resources and can drag the number down.
Everything runs locally in the page, so there’s nothing to install and no data leaves your device.
Reading your results without fooling yourself
The most common surprise is an FPS number that seems “too low” — say, an animation that won’t go above your refresh rate. That’s not a fault; it’s the vsync ceiling doing its job. A browser animation is capped at the display’s refresh rate, so a 60 Hz screen tops out around 60 FPS by design.
The second surprise runs the other way: a high average FPS that still looks stuttery. That’s exactly the case 1% lows and the frame-time graph exist to catch. Trust the consistency of frame time over the size of the average.
A few honest caveats keep the results meaningful:
- Background tabs get throttled. Browsers deliberately slow
requestAnimationFramein tabs that aren’t visible to save power, so always measure in the foreground. - Power-saving can lower your refresh rate. Laptops on battery sometimes drop the panel to a lower refresh to save energy, which lowers the FPS ceiling. If you see this, check whether you’re on battery.
- The browser can only measure frames it draws. It reports the cadence of its own animation reaching the screen — it can’t read your GPU’s temperature, utilisation, VRAM, or power draw, because no web API exposes those.
If your measured FPS is stubbornly below the refresh rate your display is set to, it’s worth confirming the display is actually running at the rate you think — the guide on checking your monitor’s real-time FPS covers how the advertised, configured, and delivered rates can differ.
Frequently asked questions
Why is my FPS capped at 60 (or my refresh rate)?
Because a display can only show a new frame when it refreshes, and browser animations are synchronised to that refresh via vsync. On a 60 Hz panel there are only 60 opportunities per second to show a frame, so the test tops out around 60 FPS. To see higher numbers you need a higher-refresh display.
Is a browser FPS test accurate?
For measuring the cadence of frames reaching your screen, yes — requestAnimationFrame is tied to the display’s actual repaint, so it reflects real, vsync-included frame delivery rather than a theoretical figure. What it can’t do is read hardware sensors like temperature or GPU load; those simply aren’t available to a web page.
What’s the difference between FPS and frame time?
They’re two views of the same data. Frame time is how many milliseconds each frame takes; FPS is how many of those frames fit into a second. Frame time is more sensitive to stutter because a single long frame shows up immediately, whereas FPS averages it away.
My average FPS is high but motion looks choppy — why?
Because the average hides bad frames. A few frames that take far too long create visible hitches while barely moving a per-second average. Look at the 1% low and the frame-time graph: if the 1% low is well below the average, you’re getting inconsistent delivery, which is what you’re seeing.
Does this test measure my GPU’s performance?
Not really — it measures how smoothly frames reach your display, which is capped by your refresh rate and easily limited by vsync long before your GPU is the bottleneck. For actual graphics throughput you’d want a dedicated benchmark; a light display animation won’t push the hardware.
FPS is a useful headline, but consistency is what your eyes actually judge, and a good display test shows you both. Run the display FPS test to see your screen’s real frame cadence, keep an eye on frame time and 1% lows rather than the average alone, and remember the number is bounded by your refresh rate. If you also want to confirm that video content is being delivered without dropped frames, the video playback test measures that side of the pipeline.
Test every key directly in your browser
Detect stuck keys, key chatter, input latency, and full rollover with our instant, zero-download diagnostic tool.
Start Keyboard Test →